An isothermal plot for an ideal gas shows one or more hyperbolas where PV is a constant. How is an isothermal plot for a van der Waals gas different?
Obtaining the Cubic Equation
We can use the van der Waals equation to plot isotherms for real gases. To recall, the equation is
- (P + a/V2)(V - b) = RT
where P is pressure, V is volume, T is temperature, R is the universal gas constant, and a and b are constants that are determined experimentally and are dependent on the gas. Because we are considering isotherms, the pressure and volume vary along a curve while the temperature does not.
If we multiply equation 1 by V2, we obtain
- PV3 - (Pb + RT)V2 + aV - ab = 0.
This is a cubic equation with three roots of which two must be real, and in this form it is easier to use it to make our graphs.
Isotherms for Ideal Gases
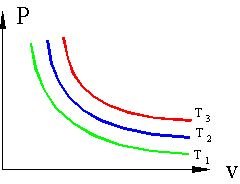
Figure 1 shows a typical PV plot of isothermal processes for an ideal gas. T1, T2, and T3 represent isotherms of increasing temperature. The curves show hyperbolas of PV = constant. As the pressure decreases, the volume increases and vice versa.
Isotherms for Real Gases
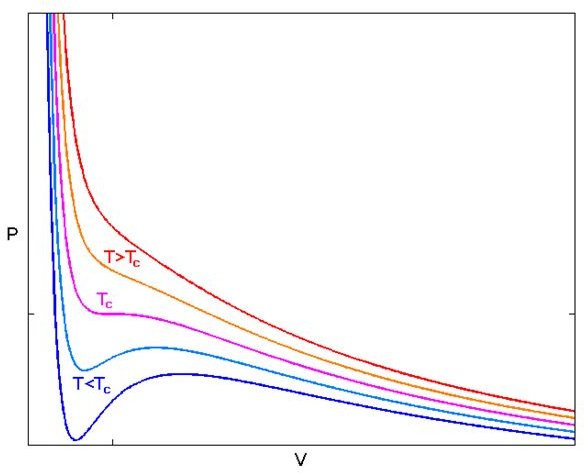
Figure 2 shows an isothermal plot for a real gas. For large T, the isotherms look like those of an ideal gas. But as T falls, especially below a critical temperature TC, we see that the behavior is no longer ideal. The curves below Tc pass through a phase change of liquid to vapor.
The critical temperature TC has a inflection or critical point CP, where the pressure is transitioning from decreasing to increasing. As we go along an isotherm along or below TC, the pressure decreases, and begins increasing til we reach a maximum. Then the pressure begins falling again and becomes more or less constant. Because the pressure no longer increases as the volume becomes less, these regions are unstable.
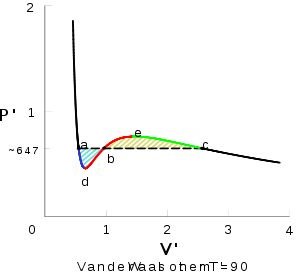
Figure 3 shows an isotherm below TC that is labelled for clarification purposes. Starting at the right side of the diagram, the area after point c is where the pressure eventually becomes basically constant and the volume is small. Point c is where condensation occurs as the gas begins liquefying as we continue along the left of the plot. Between c and b is a phase where the liquid and vapor are in equilibrium. Point e is a maximum, and point d is a minimum. Ed is unstable and has not been observed in a lab. Pure supersaturated vapors have been measured along ec, and supercooled liquids have been measured along ad. Remember, supersaturated liquids have dissolved solute beyond the solubility limit, and supercooled liquids are those that are cooled to temperatures below that of their ordinary freezing points.
At point a, the substance is now wholly a liquid. The pressure begins rising rapidly because it takes a great deal of it to compress a liquid.
Is is important to note that above TC, no matter how large the pressure, it is not possible to liquefy a gas.
In the next part of the series, we will examine the van der Waals equation in light of carbon dioxide.
Image Credits
Figure 1 from Pezhe.com
Figure 2 from from Wikimedia Commons
Figure 3 from Answers.com
Resources
A Supersaturated Sugar Experiment
A Very Cool Supercooled Water Experiment Video
Pressure-Volume Isotherm applet For Real Gases (Java is required)
This post is part of the series: The Equation of State for Real Gases
A basic introduction to van der Waal’s equation of state for real gases.