The average ocean temperatures are rising in the worlds oceans, mainly within the layer of seawater starting 800 yards below the surface. Rising temperatures are being monitored by various modern underwater temperature probes, showing an average rise in seawater temperatures of 0.36ᴼC above normal.
Introduction - Average Ocean Temperature Increases 1970 to 2010
There are some gaps in the recording of average ocean temperatures increases 1970-2010, which was the original intent to write about for this article. However, a more accurate means of measuring ocean temperatures has been developed over the last decade, ensuring more regular monitoring from an increased number and types of underwater probes. This has confirmed a rise in the world’s ocean temperatures that, according to oceanographers, is due to global warming.
This is an article on the investigation of average ocean temperatures over the last four decades; here we will look at the methods used to measure and record the temperatures of the oceans, along with the world-wide ocean locations being used for this research. We begin then with a look at the methods currently used to measure the ocean temperatures.
Methods and Equipment Utilized in Measuring Ocean Temperatures
The original method of recording ocean temperature from a ship was to throw a canvas bucket over the side. It was allowed to sink into the seawater and on recovery; the temperature was taken and recorded.
Nowadays, more modern methods are used and we shall examine three of these high tech methods especially developed to record ocean temperatures:
1. Moored Buoys
Moored buoys are used to measure the meteorology of the surface above the ocean; wind, air temperatures and rainfall. They also have underwater probes that record the temperature, salinity and currents of the ocean, sinking and rising in depths of around 800 yards.
The buoys are located in the Pacific, Atlantic and Indian Oceans, from where the recorded data is transmitted by satellite to oceanographers worldwide.
2. Ships Of Opportunity Program (SOOP)
A number of cargo ships sailing through the Pacific and Atlantic Oceans, have been contracted by SOOP to record the seawater temperatures and salinity over the vast expanses of these oceans. They record this data through the use of thermosalinographs, instruments mounted in the cooling water inlets of the ships’ engine rooms.
The data is then transmitted worldwide by satellite to interested parties.
3. Thermal Gliders
Thermal gliders are a recent addition to the methods of measuring and recording ocean temperatures, operating on renewable thermal energy supplied by the ocean.
A prototype has been successfully tested in the Caribbean, having travelled for several months and thousands of miles underwater.
When operational the thermal glider will record sea temperature and salinity at various depths through sensors in its nosecone. At the end of the exercise, the thermal glider will rise to the surface, signal its location, and transmit recorded data by satellite to oceanographers worldwide.
References on the Web:
1. argus - methods and equipment used in monitoring of ocean temperatures.
2. Jamstec - temperature monitoring buoys
3. oceanus – thermal gliders.
Increases in Ocean Temperatures
When representing the average change in ocean temperatures in graphs and charts, it is not the actual temperature that is used, as there are too many variables to give an accurate representation.
Instead, the average normal temperature is calculated for each location from past records from a known base period.
It is the difference between the normal temperature and the latest recorded temperature for this area that is used, being known as temperature anomalies.
Reading the various graphs produced by worldwide oceanographers, we can see the trend towards rising ocean temperatures.
Some graphs show temperature anomalies recorded over the last four decades, however these have been found to have gaps in the records. It is better therefore to examine graphs which use data collected over the last decade or so when the more accurate and reliable means of recording temperatures were developed and employed.
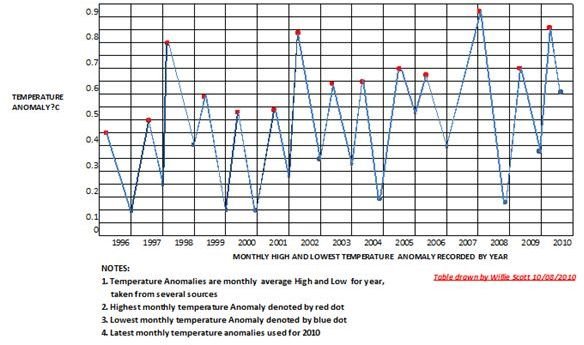
I have constructed one such graph, using the average oceans temperatures anomalies recorded between the 1996 and 2010 period. From this we can calculate the average temperature anomalies for this period which is 0.36ᴼC.
I have shown this graph in the Image Section at the end of the article. Please note that I have used several sources to achieve average ocean temperature anomalies, but they still represent the current rise in ocean temperatures worldwide.
References:
- indiatimes - ocean warming
- nasa - Ocean temperature anomalies data