The salinity of the ocean is strongly related to temperature. In order to estimate ocean salinity without conducting tests, it is helpful to read approximate values off of a chart. This article contains a temperature salinity diagram for this purpose.
The salinity of the ocean is a function of several factors; one major factor is temperature. Salinity and water temperature are closely related; this relationship, combined with empirical data, allows for the creation of a temperature salinity diagram.
Definition of Salinity
Just as a review, the definition of salinity is, generally speaking, the salt content of seawater. A more official definition comes from the International Council for the Exploration of the Sea: “Total amount of solid materials in grams dissolved in one kilogram of sea water when all the carbonate has been converted to oxide, the bromine and iodine replaced by chlorine and all organic matter completely oxidized.”
Note, however, that conductivity is defined according to conductivity today. The relation is calculated according to the Practical Salinity Scale (PSS) of 1978. This relationship is very strong, with an error of just ± 0.003 parts per thousand.
Temperature Salinity Diagram
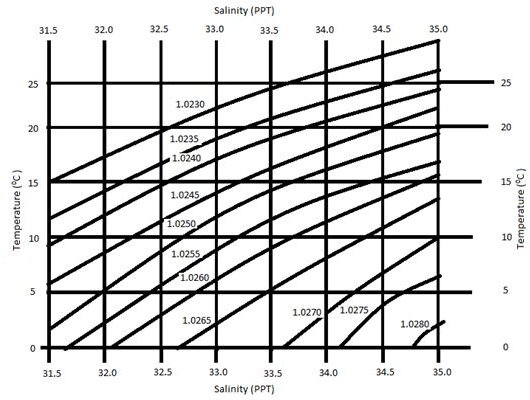
To display a useful temperature salinity diagram, it is necessary to also include density. The following diagram, therefore, includes several density lines.
How to read this diagram: first, click on the image below for a full-size view. Next, choose the line corresponding to the sea surface temperature (SST). Follow this line until it intersects the density curve. At this point of intersection, draw a line vertically up or down to the salinity scale and read off the value. The salinity values are accurate to one decimal place.
Note: density is given in g/cm3.
Where does the Sea’s Salinity Come From?
The sea’s salinity comes from a variety of dissolved salts and minerals. The primary salt in the ocean is NaCl, commonly known as table salt (or sea salt in this case). This salt dissociates into sodium and chloride ions in the ocean. The makeup of seawater salinity is as follows:
- Chlorine: 55.3%
- Sodium: 30.8%
- Sulfate: 7.7%
- Sulfur: 2.6%
- Magnesium: 3.7%
- Calcium: 1.2%
- Potassium: 1.1%
The salinity of the oceans increases very slowly due to the weathering of continents and undersea venting. In some locations, the salinity of the ocean can vary significantly from models due to the influx of freshwater. This effect is prominent in estuaries and other areas near river exits. Additionally, sea salinity variation is caused by temperature, pressure, and depth. The average surface salinity of seawater is 35 ppt, or 3.5%.
Effects of Salinity
Buoyancy is directly affected by the density of water: the more dense water is, the more buoyancy it will have. The greater the salinity of water, the greater its density; salinity, therefore, increases buoyancy.
Why is salinity a problem?
High salinity can pose problems for boats. The increased salinity can increase rusting (oxidation) in vulnerable parts, such as motors. This may pose a particular problem in the future, as studies show that tropical waters are becoming markedly saltier. Though scientists are unsure as to the cause of this phenomenon, global warming may play a role.
While salinity in tropical and sub-tropical waters has increased, it has decreased in waters farther north. This could have dramatic repercussions for sea life, as well as weather patterns worldwide.
Sources
Temperature, Salinity, and Density