A simple explanation of Marine Navigational charts
What information does a chart show?
A Marine Navigational chart is a map of maritime and coastal areas, ports and harbours and approaches to these. There are thousands of these charts which cover the earth’s oceans, rivers and ports. Depending on how much detail is required, a suitable scale is used (more later).
On the chart and depending on this scale (the larger the scale the more information is available on the chart) the following may be shown: heights of land and depths of ocean, details of lighthouses and buoys, currents and tidal information, features of the coastline and seabed and details of variation may be shown.
(For more on variation, read this article about marine navigation equipment
Closer to the coast, approaches and buoyage systems to harbours and details of man made construction will be shown if they are pertinent to the mariner, like landmarks, lighthouses etc. Pilotage information is shown- a pilot is a mariner with local knowledge who assists the Captain (Master) of a ship in navigating into and out of the port.
Information is shown in the form of symbols and abbreviations to avoid cluttering the chart: the meaning of each of these is explained in BA 5011, a publication carried on all ships and the ‘bible’ for navigators worldwide.
Charts will also show other relevant information, eg: positions where we report to shore authorities by VHF (radio) at sea, giving details of the ship to them.
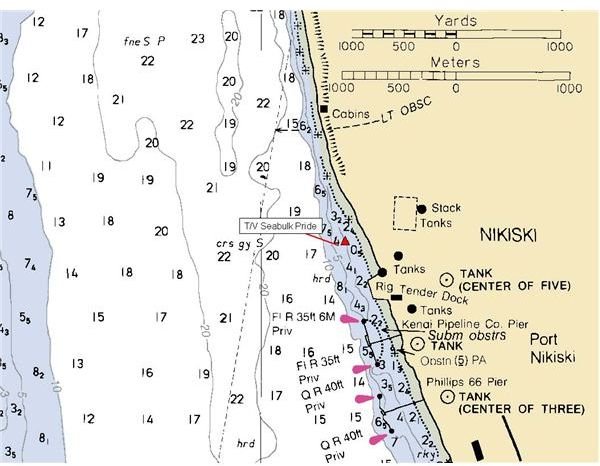
A typical harbour chart
How is a chart made?
For ease of use, a nautical chart is detailed on paper and usually follows the Mercator projection which is a form of cylindrical projection. Put simply, this is akin to imagining the earth to be like an orange whose segments are opened and flattened out on a paper so that their edges (corresponding to the longitudes on earth) become parallel on the paper- the chart.
A few charts are made using different projections (eg. gnomonic) but these are usually charts a navigator uses for reference, and not navigation.
Charts are made by hydrographic departments across the world. The British Admiralty (BA) charts are the most commonly used ones worldwide. They are catalogued and must be corrected weekly on board- notices (details of corrections) are sent by the BA for this purpose.
Scale, Types of charts and some Terminology
A chart with a scale (marked on the chart) of 1:500000 implies that every unit of measurement on the chart is equivalent to 500000 units of measurement on the earth’s surface. (eg 1 cm on this chart will be 500000 cm on the earth’s surface). Charts are made with all kinds of scale, depending on how much detail is required for navigational safety.
Sailing charts are open sea charts. Land may be depicted as a rough contour and these charts are used far from land in ocean regions.
General charts cover coastal areas outside the immediate areas of reefs or shoals (where the water depth is very low and navigation more dangerous)
Coastal charts cover areas closer to the coast and give greater detail of outlying dangers.
Harbour charts are intended for use in approaching harbours and in mooring ships to berths, usually under pilotage. They have the greatest detail.
Soundings refer to the depth of the water at a location and is marked on the chart after hydrographic surveys.
A compass rose is a easy means- for a navigator- of finding direction on the chart and also plotting a ship’s course, besides taking bearings (angles) of objects with a compass. Called because it looks like a rose petal opened up, it is graded from 0 degrees to 360 degrees, with 0 being North, 90 being E, 180 being S and 270 being W.
Routeing and Passage Planning charts are small scale (cover large areas) and give information on winds, currents, icebergs and general information which assists us in planning a voyage at sea. These charts are not directly used for navigation.
There are some other kinds of charts, but the ones above are the main types.
Use of a nautical chart in practice
The largest scale chart available is used since it gives us the best detail of topography and landmarks. On this, a ships planned course is plotted (drawn with a pencil) by the navigator. As the ship proceeds on the passage, its position (Latitude and Longitude) is plotted on the courseline to confirm that the plan is being followed, and to steer away from any dangers.
Navigational charts are required to be carried by law for the passage planned. It is an essential tool for a navigator to plan and ensure that his ship proceeds safely to the destination. Although electronic charts are slowly becoming more popular, it will be a long time before they replace paper charts completely.
References
Image of Harbour chart taken from https://www.dec.state.ak.us/